Aerodynamically, why curved edge tires are better than flat edge?
- Akshay Kumar Pakala

- Dec 2, 2020
- 5 min read
1) Introduction
Automobiles, for instance, formula one or passenger vehicles, while in motion experiences a drag force due to the surrounding air. In pursuit to overcome this force, automobiles expends significant amount of fuel consumption which leads to a decrease in the fuel efficiency and performance of a vehicle. One of the many ways to reduce this deficiency of the vehicle is to understand the effects of its geometry to the drag force. Geometry of the vehicle such as tires and wheels can be responsible for generating a great amount of vehicular drag force. According to Wright [1], “The drag of the wheel represents 40% of the vehicular drag”. Due to the rotational motion, grooves and design of the tire, a significant amount of drag force is generated in the under-body of the vehicle. Thus, for the present study, various numerical simulations are conducted to examine the effects of drag force on the design (curved and fat vertical edges of the tire) and rotational motion of the tire.
2) Geometry and mesh
Geometry of the tires and wheels (see Fig. 2.4-2.5), and enclosures (see Fig. 2.1) are designed using Ansys design modeler. Dimensions of the enclosure and the mesh sizes are decided by conducting a grid independent analysis [2]. Figures illustrating the geometric descriptions of the enclosure and mesh (see Fig. 2.2-2.3) are given below
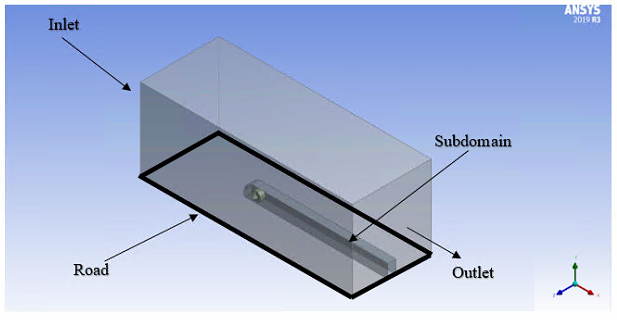
Figure 2.1: Isometric view of the 3-D enclosure
(a) (b)
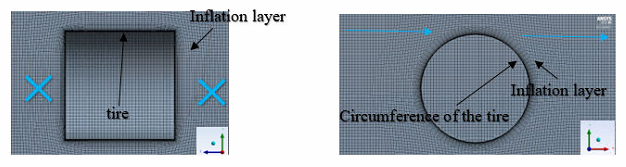
Figure 2.2: 3-D inflation layer mesh around the tire. (a) perpendicular to the flow (b) parallel to the flow
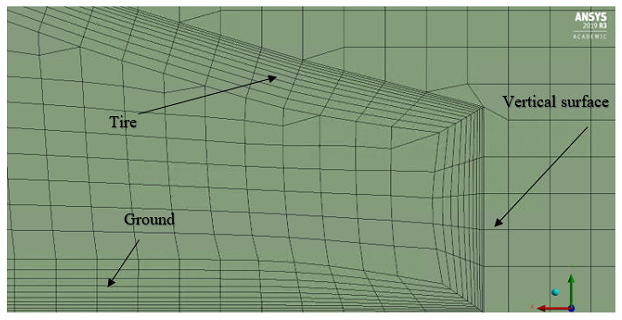
Figure 2.3: 3-D inflation layer mesh near the road and tire
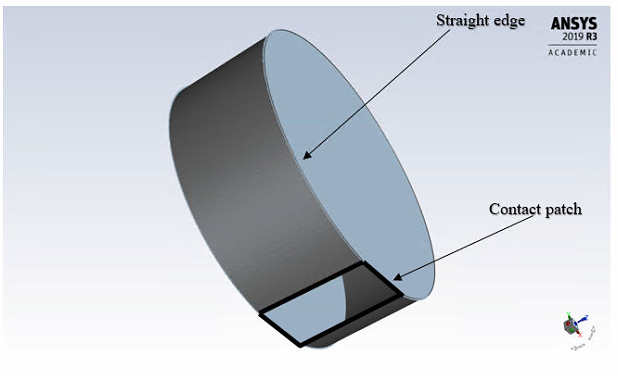
Figure 2.4: 3-D straight edge tire
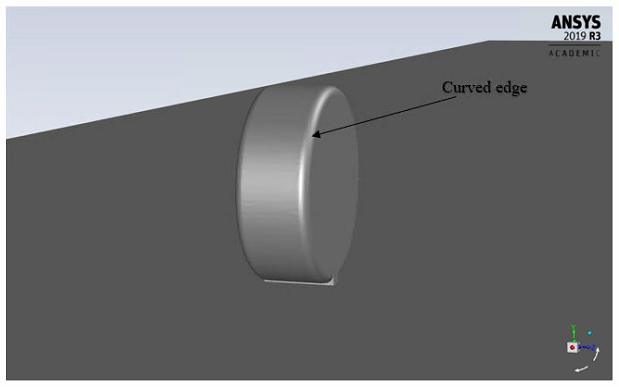
Figure 2.5: 3-D curved edge tire
The curved edge tire (see Fig. 2.5) is designed by applying a 10 mm filet radius on its vertical edges.
3) Boundary conditions
Moving no slip wall boundary condition is given to the road. Velocity assigned to the road is equal to the free stream velocity of the air at the inlet.
The side and top walls of the enclosure are assigned with slip boundary condition.
Velocity inlet boundary condition is allocated to the inlet face of the enclosure.
Pressure outlet boundary condition is assigned to the outlet face of the enclosure.
Rotating no slip boundary condition is assigned to the surfaces of the tire. The rotational velocity of the tire and wheel is equal to the ratio of the free stream velocity of the air to its radius.
4) Numerical setup
The simulation is carried out at Re=5.3x10^5. The turbulence of the air is resolved using a k-transition turbulence model. The equations of the turbulence model, momentum are descritized using the second order upwind scheme. SIMPLEC algorithm is used to solve the descritized equations. After achieving the a converged state in the solution, the drag coefficient of the curved and straight edge tires are post processed and compared. static pressure and velocity contours are utilized to analyze the drag exerted by the air on the tire and wheel.
5) Results
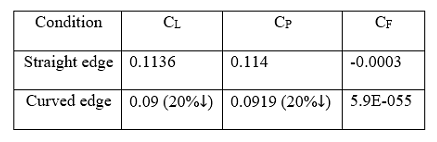
Table 5.1: Drag, pressure and skin friction coefficients for the curved and straight edge tires at Re=5.3x10^5
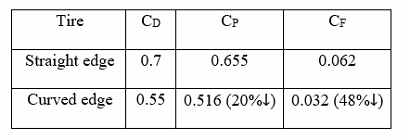
The coefficient of drag for the tire and wheel with curved edges is decreased by 21%, compared to the straight edge tire (see Table 5.1). This indicates that the curved edge tire is aerodynamically efficient, compared to the straight edge tire. This decrease in the coefficient of drag can be analyzed by understanding the decrease in the pressure and skin friction coefficient values for the curved edge tire (see Table 5.1). Results from the table 5.1 indicate that the skin friction coefficient is decreased by 48%, whereas, the pressure coefficient value is decreased just by 20%. Thus, the decrease in the coefficient of drag for the curved edge tire is analyzed by plotting and comparing the skin friction coefficient values of the two tires. Skin friction coefficient acting on the top half surface and mid cross section of the two tires are post processed and compared with each other.
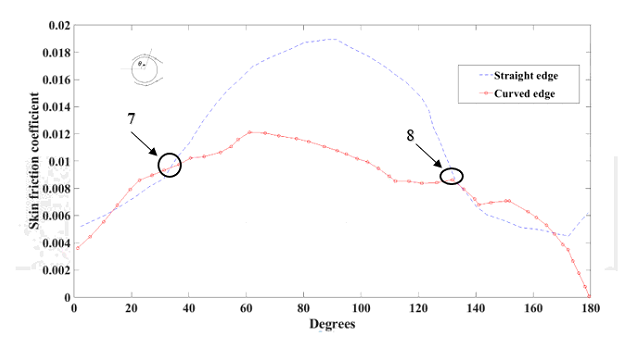
Figure 5.1: Skin friction coefficient as a function of degrees (clockwise) at mid cross section for the curved and straight edge tires at Re=5.3x10^5. Here, 0 degrees is the upstream stagnation point and 180 is the downstream stagnation point.
The skin friction coefficient acting on the straight edge tire exceeds the curved edge tire at Point 7 (see Fig. 5.1). This increase in the skin friction coefficient for the straight edge tire at Point 7 continues to Point 8 (see Fig. 5.1). Roundness, when imposed on the vertical edges of the tire, reduced the skin friction force exerted by the airflow on the tire. Hence, improving the overall aerodynamic efficiency of the tire.
To truly understand the functioning of the vertical edges and its effects on the decreased coefficient of drag, skin friction coefficient values acting on the vertical edges of the two post processed and compared.
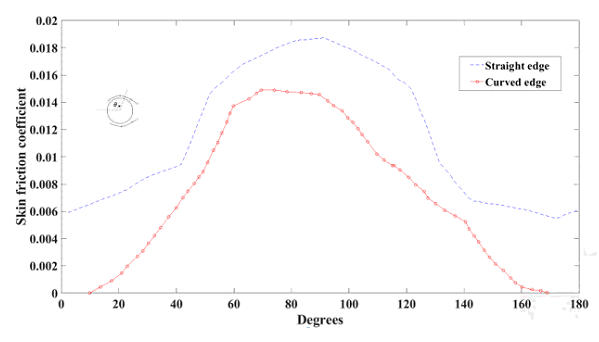
Figure 5.2: Skin friction coefficient as a function of degrees (clockwise) on top half vertical edge of the curved and straight edge tires at Re=5.3x10^5
Values of the skin friction coefficient on the edges of the two tires indicate a higher wall shear force for the straight edge tire, compared to the curved edge tire (see Fig. 5.2). This decrease in the wall shear force occurs at all degrees for the curved edge tire, compared to the straight edge tire (see Fig. 5.2). As a result, a major decrease in skin friction coefficient is occurred for the curved edge tire, compared to the straight edge tire on the vertical edge.
(a) (b)
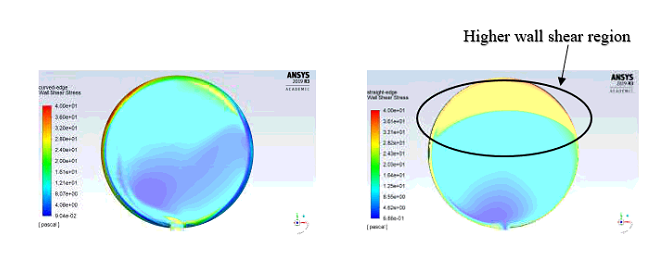
Figure 5.3: Wall shear contours on the vertical surface. (a) Curved edge tire, (b) Straight edge tire
Decrease in wall shear on the vertical surfaces for the curved edge tire is also analyzed by plotting the wall shear stress contours on the vertical surface of the two tires (straight edge and curved edge tires). These wall shear contours indicate that the straight edge tire experiences a larger shear stress at the top half of the vertical surface, compared to the curved edge tire.
Table 5.2: Lift, pressure and skin friction coefficients for the curved and straight edge tires at Re=5.3x10^5
The coefficient of lift for the curved edge tire is slightly decreased, compared to the straight edge tire (see Table 5.2). This minor reduction in the coefficient of lift is understood by plotting the velocity contours on XY plane that is placed at the mid cross section and parallel to the flow.
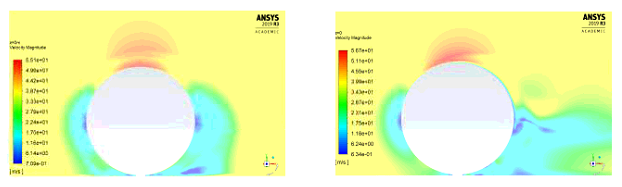
(a) (b)
Figure 5.4: Velocity contours at the mid cross section for Re=5.3x10^5 (a) curved edge tire (b) flat edge tire
Velocity contours (see Fig. 5.4) indicate that the velocity of the air between the tire and ground, and downstream of the straight edge tire is marginally lesser, compared to the curved edge tire. Velocities of the air flowing on the top surface of both the tires are approximately identical for the straight and curved edge tire (see Fig. 5.4). Thus, according to Bernoulli’s principle, the net pressure force acting vertically upwards on the straight edge tire is slightly higher, compared to the curved edge tire. As a result, the coefficient of lift for the curved edge tire is slightly lower, compared to the straight edge tire.
In conclusion, the curved edge tire is aerodynamically efficient than the straight edge tire.
References
[1] Wright, P. G., 1982, “The Influence of Aerodynamics on the Design of Formula One Racing Cars,” International Journal of Vehicle Design., 3(4), pp. 383-397.
[2] Pakala, A. K., 2020, "Aerodynamic Analysis of Conventional and Spherical Tires," MS. c thesis, University of Akron.
Important note: Information, pictures, graphs, tables and data presented in this blog is borrowed from Akshay Kumar Pakala's Master's thesis document.

Comments